Multiple Choice
Use the figure below to answer the following question(s) .
Figure 4-8 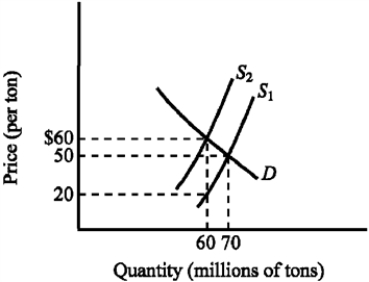
-Refer to Figure 4-8. The supply curve S1 and the demand curve D indicate initial conditions in the market for soft coal. A $40-per-ton tax on soft coal is levied, shifting the supply curve from S1 to S2. Imposing the tax increases the equilibrium price of soft coal from
A) $20 to $60 per ton.
B) $20 to $50 per ton.
C) $50 to $60 per ton.
D) $50 to $90 per ton.
Correct Answer:

Verified
Correct Answer:
Verified
Q21: The "incidence of a tax" is the
Q22: Which of the following statements regarding black
Q23: Figure 4-21 <img src="https://d2lvgg3v3hfg70.cloudfront.net/TB7348/.jpg" alt="Figure 4-21
Q24: Other things constant, how will a decrease
Q25: Economic analysis indicates minimum wage legislation has<br>A)
Q27: If the government wants to generate large
Q28: Use the figure below illustrating the impact
Q29: The actual burden of a tax<br>A) falls
Q30: Under rent control, tenants can expect<br>A) lower
Q31: Figure 4-25 <img src="https://d2lvgg3v3hfg70.cloudfront.net/TB7348/.jpg" alt="Figure 4-25