menu-iconExamlexExamLexServices

Discover

Ask a Question
  1. All Topics
  2. Topic
    Business
  3. Study Set
    Microeconomics Private and Public Choice Study Set 1
  4. Exam
    Exam 3: Demand, Supply, and the Market Process
  5. Question
    Figure 3-18 -Refer to Figure 3-18. When the Price Falls from P<sub>1</sub>
Solved

Figure 3-18 -Refer to Figure 3-18. When the Price Falls from P1

Question 123

Question 123

Multiple Choice

Figure 3-18 Figure 3-18   -Refer to Figure 3-18. When the price falls from P<sub>1</sub> to P<sub>2</sub>, which area represents the increase in consumer surplus to new buyers entering the market? A)  ABD B)  ACF C)  BCDE D)  DEF
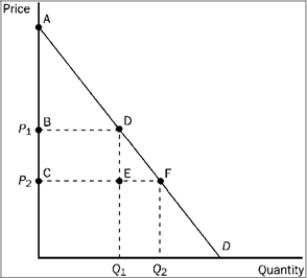
-Refer to Figure 3-18. When the price falls from P1 to P2, which area represents the increase in consumer surplus to new buyers entering the market?


A) ABD
B) ACF
C) BCDE
D) DEF

Correct Answer:

verifed

Verified

Unlock this answer now
Get Access to more Verified Answers free of charge

Related Questions

Q118: During the 1970s, the price/earnings ratio of

Q119: Which of the following would lead to

Q120: When competition is present and property rights

Q121: If salsa and nacho chips are complements,

Q122: Which of the following is true?<br>A) Managed

Q124: Which of the following about investments is

Q125: Compared to other investments such as bonds,

Q126: Suppose demand increases and supply decreases. Which

Q127: Figure 3-22 <img src="https://d2lvgg3v3hfg70.cloudfront.net/TB7348/.jpg" alt="Figure 3-22

Q128: An indexed equity mutual fund<br>A) is directly

Examlex

ExamLex

About UsContact UsPerks CenterHomeschoolingTest Prep

Work With Us

Campus RepresentativeInfluencers

Links

FaqPricingChrome Extension

Download The App

Get App StoreGet Google Play

Policies

Privacy PolicyTerms of ServiceHonor CodeCommunity Guidelines

Scan To Download

qr-code

Copyright © (2025) ExamLex LLC.

Privacy PolicyTerms Of ServiceHonor CodeCommunity Guidelines