Multiple Choice
Figure 3-22 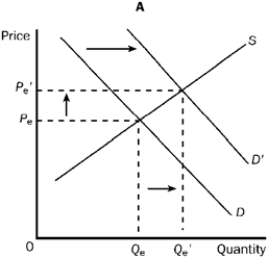
-Refer to Figure 3-22. Graph A shows which of the following?
A) An increase in demand and an increase in quantity supplied.
B) An increase in demand and an increase in supply.
C) An increase in quantity demanded and an increase in quantity supplied.
D) An increase in supply and an increase in quantity demanded.
Correct Answer:

Verified
Correct Answer:
Verified
Q122: Which of the following is true?<br>A) Managed
Q123: Figure 3-18 <img src="https://d2lvgg3v3hfg70.cloudfront.net/TB7348/.jpg" alt="Figure 3-18
Q124: Which of the following about investments is
Q125: Compared to other investments such as bonds,
Q126: Suppose demand increases and supply decreases. Which
Q128: An indexed equity mutual fund<br>A) is directly
Q129: Two goods are considered substitutes if<br>A) a
Q130: Laqueta buys a new GPS device for
Q131: If the demand for a good is
Q132: If a small percentage increase in the