Multiple Choice
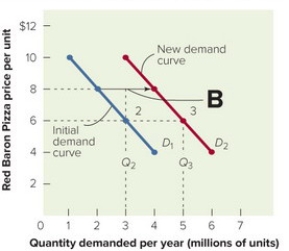 Figure 13-4B
-A shift of the demand curve from D2to D3in Figure 13-4B above indicates
A) fewer units are demanded at the given price.
B) more units are demanded at the given price.
C) the price has decreased.
D) the price has increased.
E) there is not enough information given to indicate what happened.
Correct Answer:

Verified
Correct Answer:
Verified
Q41: While pricing objectives frequently reflect corporate goals,
Q42: Describe the types of competitive markets and
Q43: If you know the contents and price
Q44: From a marketing viewpoint, _ is the
Q45: <img src="https://d2lvgg3v3hfg70.cloudfront.net/TB7462/.jpg" alt=" Figure 13-7B -In
Q47: According to the price equation, final price
Q48: Economists have identified four types of competitive
Q49: Companies are reluctant to lower their selling
Q50: Distinguish between elastic demand and inelastic demand.
Q51: Factors that determine consumers' willingness and ability