Multiple Choice
This figure depicts population growth for three different populations. 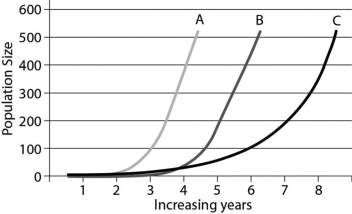
-Assume the three populations represent three populations of the same species of bird that all live in the same geographic area. All population sizes are equal, and data collected on the populations' growth rates all started on the same day. There are several plausible reasons why population C has the slowest growth rate. Choose the exception.
A) Population C started with the greatest number of birds in their reproductive prime.
B) Birds in Population C laid fewer eggs per clutch than in the other two populations.
C) Population C had greater numbers of natural predators in their niche than the other two populations.
Correct Answer:

Verified
Correct Answer:
Verified
Q42: The Endangered Species Act aims to help
Q43: Competition among individuals of the same species
Q44: This figure depicts population growth for three
Q45: <b>Scenario</b><br>Michigan's Isle Royale is an island located
Q46: Suppose a plane is forced to make
Q47: If there are 500 oak trees in
Q48: <b>Scenario</b><br>Michigan's Isle Royale is an island located
Q49: Which possible description best matches this figure?
Q50: Which option best describes Type II survivorship
Q51: The intentional release of a natural enemy