Multiple Choice
Table
Factors for Calculating Three- Sigma Limits for the - chart and -chart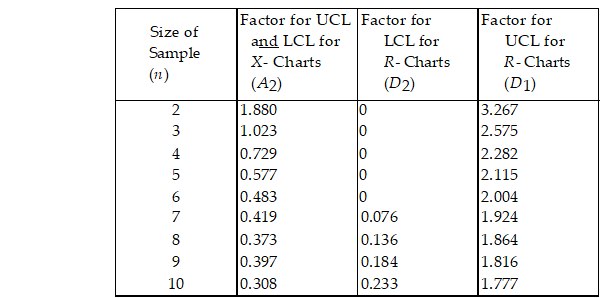
-Historically, the average diameter of the holes drilled has been 0.25 cm and the average range has been 0.1 cm. Determine the central line and upper and lower control limits for an and an  R- chart, assuming samples of size 8 will be taken. Use Table 7.1.For the chart, what is the value of the
A) less than or equal to 0.10
B) greater than 0.10 but less than or equal to 0.19
C) greater than 0.19 but less than or equal to 0.29
D) greater than 0.29
Correct Answer:

Verified
Correct Answer:
Verified
Q31: Benchmarking is a continuous, systematic procedure that
Q127: Functional benchmarking is based on comparisons with
Q128: Most experts estimate the cost of poor
Q129: Which one of the following statements is
Q130: Which one of the following is a
Q131: When customers are upset with their bank
Q133: The additional time incurred if an item
Q134: Special- purpose teams take worker participation to
Q136: A manufacturer of silk inspects each bolt
Q137: The most thorough approach to inspection is