Short Answer
The figure shows a pV diagram for a gas going through a cycle from A to B to C and back to A. From point A to point B, the gas absorbs 50 J of heat and finds its internal (thermal)energy has increased by 20 J. Going from B to C, the internal (thermal)energy decreases by 5.0 J.
(a)How much work was done by the gas from A to B?
(b)How much heat was absorbed by the gas from B to C?
(c)How much work was done by the gas going from B to C? 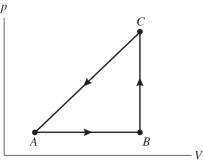
Correct Answer:

Verified
(a)30 J (b...View Answer
Unlock this answer now
Get Access to more Verified Answers free of charge
Correct Answer:
Verified
View Answer
Unlock this answer now
Get Access to more Verified Answers free of charge
Q25: A heat engine with an efficiency of
Q30: A cyclic process is carried out on
Q31: An ideal Carnot heat engine operates
Q33: An ideal Carnot engine is operated
Q35: An ideal Carnot heat engine has
Q37: A cyclic process is carried out on
Q58: An air conditioner with a coefficient of
Q71: Which of the following is a false
Q79: In an isochoric process,the internal (thermal)energy of
Q93: At what,if any,temperature are the numerical readings