Essay
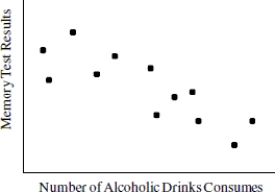
The scatterplot below shows the number of alcoholic drinks consumed and memory test results for some college students. Is there an association? If so, describe the pattern. Be sure to comment on trend, shape, and the strength of the association.
Correct Answer:

Verified
Consuming more alcoholic drink...View Answer
Unlock this answer now
Get Access to more Verified Answers free of charge
Correct Answer:
Verified
View Answer
Unlock this answer now
Get Access to more Verified Answers free of charge
Q1: What key things should you look for
Q2: Use the following information to answer the
Q3: r = - 0.3526<br>A) <img src="https://d2lvgg3v3hfg70.cloudfront.net/TB5647/.jpg" alt="r
Q5: The scatterplot below shows the ice cream
Q6: The figures below show the relationship between
Q7: A concert ticket agent is going to
Q8: r = - 0.6542<br>A) <img src="https://d2lvgg3v3hfg70.cloudfront.net/TB5647/.jpg" alt="r
Q9: Use the following information to answer the
Q10: Explain in your own words what extrapolation
Q11: Use the data provided in the table