Essay
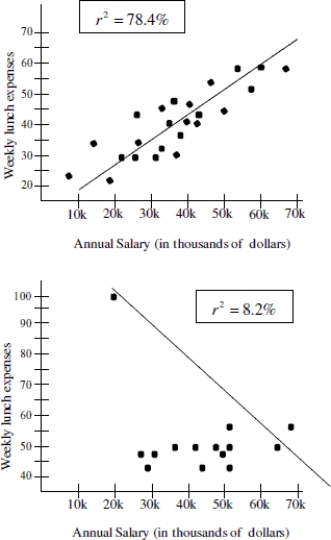
The figures below show the relationship between salary and personal lunch expenses on week days for a group of business men. Comment on the difference in graphs and in the coefficient of determination between the graph that includes a data point of someone who reported earnings of $21,000 per year and weekly personal lunch expenses of $100 per week (second graph)and the graph that did not include this data point (first graph).
Correct Answer:

Verified
The coefficient of determinati...View Answer
Unlock this answer now
Get Access to more Verified Answers free of charge
Correct Answer:
Verified
View Answer
Unlock this answer now
Get Access to more Verified Answers free of charge
Q1: What key things should you look for
Q2: Use the following information to answer the
Q3: r = - 0.3526<br>A) <img src="https://d2lvgg3v3hfg70.cloudfront.net/TB5647/.jpg" alt="r
Q4: The scatterplot below shows the number of
Q5: The scatterplot below shows the ice cream
Q7: A concert ticket agent is going to
Q8: r = - 0.6542<br>A) <img src="https://d2lvgg3v3hfg70.cloudfront.net/TB5647/.jpg" alt="r
Q9: Use the following information to answer the
Q10: Explain in your own words what extrapolation
Q11: Use the data provided in the table