Short Answer
Use the following information to answer the question. A scatterplot of data from a large sample of adult women shows that height in inches and weight in pounds have a linear association. Shown below are the outputs from two different statistical technologies (TI- 83/84 Calculator and Excel).
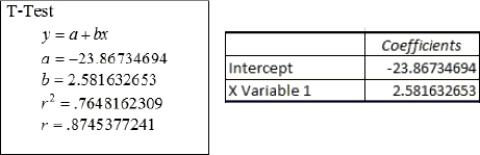
-Height and weight charts for women show that a woman who is 71 inches tall has a target weight between 135 and 176 pounds. Would the regression model you found for the large sample of (in question 15)place a woman who was 71 inches tall within this range?
Correct Answer:

Verified
Correct Answer:
Verified
Q10: Explain in your own words what extrapolation
Q11: Use the data provided in the table
Q12: The following calculator screenshots show the scatterplot
Q13: Suppose it has been established that "home
Q14: In the NHL, the correlation between "Goals
Q16: Doctors believe that smoking cigarettes inflames the
Q17: Use the data provided in the table
Q18: Use the following information to answer the
Q19: r = 0.8787<br>A) <img src="https://d2lvgg3v3hfg70.cloudfront.net/TB5647/.jpg" alt="r =
Q20: The scatterplot below shows the number of