Essay
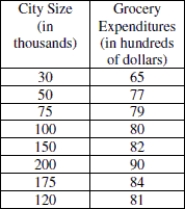
Use the data provided in the table below to answer the question. The table shows city size and annual grocery expenditures for eight families. City size is in thousands and expenditures is in hundreds of dollars.
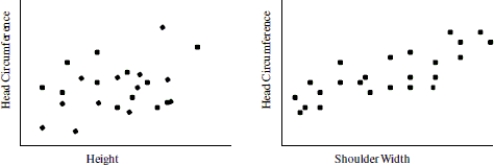
-Based on the scatterplots below, what is the better predictor for head circumference-- height or shoulder width? Explain how you made your decision.
Correct Answer:

Verified
Shoulder width; shoulder width...View Answer
Unlock this answer now
Get Access to more Verified Answers free of charge
Correct Answer:
Verified
View Answer
Unlock this answer now
Get Access to more Verified Answers free of charge
Q12: The following calculator screenshots show the scatterplot
Q13: Suppose it has been established that "home
Q14: In the NHL, the correlation between "Goals
Q15: Use the following information to answer the
Q16: Doctors believe that smoking cigarettes inflames the
Q18: Use the following information to answer the
Q19: r = 0.8787<br>A) <img src="https://d2lvgg3v3hfg70.cloudfront.net/TB5647/.jpg" alt="r =
Q20: The scatterplot below shows the number of
Q21: The following model was created to show
Q22: The table shows the number of minutes