Essay
Use the following information to answer the question. Data and summary statistics about college professor's salaries was gathered from nine institutions and is presented below. This salary information is from professors teaching at the Master's level.
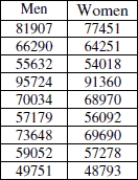

 Men: x = 67691; s = 14506 Women: x = 65323; s = 13274
-Which group has more variability? How would this affect the histogram for the group, compared to the other group? Explain.
Correct Answer:

Verified
Men's salaries have slightly more variat...View Answer
Unlock this answer now
Get Access to more Verified Answers free of charge
Correct Answer:
Verified
View Answer
Unlock this answer now
Get Access to more Verified Answers free of charge
Q11: Use the following information to answer the
Q12: Use the following information to answer the
Q13: Use the following information to answer the
Q14: The following list shows the age at
Q15: Use the following information to answer the
Q17: Use the following data to answer the
Q18: A city planner says, "The typical commute
Q19: Use the following information to answer the
Q20: In 2007, the mean price per pound
Q21: Use the following information to answer the