Essay
Use the following data to answer the question. Here are the scores on a recent statistics midterm exam (Scores have been listed from lowest to highest). A histogram showing the distribution is also included.
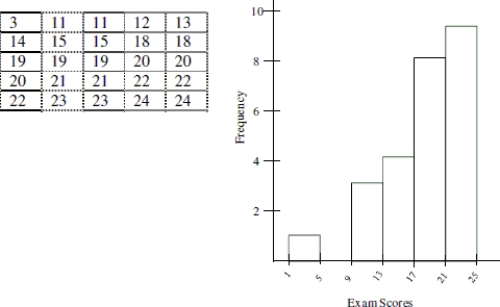
-Choose the most appropriate measure of variability for the data and calculate it. Explain why you chose the measure of variability that you did. Round all calculations to the nearest tenth if necessary.
Correct Answer:

Verified
The inter- quartile range (IQR...View Answer
Unlock this answer now
Get Access to more Verified Answers free of charge
Correct Answer:
Verified
View Answer
Unlock this answer now
Get Access to more Verified Answers free of charge
Q12: Use the following information to answer the
Q13: Use the following information to answer the
Q14: The following list shows the age at
Q15: Use the following information to answer the
Q16: Use the following information to answer the
Q18: A city planner says, "The typical commute
Q19: Use the following information to answer the
Q20: In 2007, the mean price per pound
Q21: Use the following information to answer the
Q22: Use the following information to answer the