Multiple Choice
Which of the following statements best describes the distribution and variability of the histogram below? The data in the histogram summarizes length of time on hold for a collection of customers calling a repair call center. 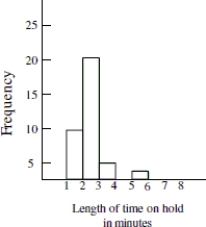
A) The distribution shows that the data was highly variable with some callers waiting on hold as many as 20 minutes.
B) The distribution is left- skewed and most callers waited on hold at least three minutes.
C) The distribution is symmetrical. The number of callers who waited on hold for less than three minutes was the same as the number of callers who waited on hold for more than three minutes.
D) The distribution is right- skewed and most callers waited on hold less than three minutes.
Correct Answer:

Verified
Correct Answer:
Verified
Q1: Data were collected on hand grip strength
Q3: The histogram below shows the distribution of
Q4: Which of the following statements about bar
Q5: Compare and describe the shape of the
Q6: Describe the shape of the distribution in
Q7: How many participants had a heart rate
Q8: Compare and contrast the important similarities and
Q9: The histogram below shows the distribution of
Q10: The following graphic was used to visually
Q11: The distribution of test scores for a