Multiple Choice
The histogram below shows the distribution of pass rates on a swimming test of all children who completed a four week summer swim course at the local YMCA. What is the typical pass rate for the swim test? 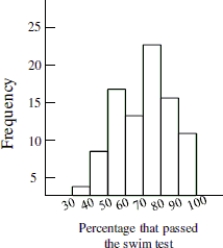
A) About 55%
B) About 95%
C) Not enough information available
D) About 75%
Correct Answer:

Verified
Correct Answer:
Verified
Q4: Which of the following statements about bar
Q5: Compare and describe the shape of the
Q6: Describe the shape of the distribution in
Q7: How many participants had a heart rate
Q8: Compare and contrast the important similarities and
Q10: The following graphic was used to visually
Q11: The distribution of test scores for a
Q12: A collection of twenty college students was
Q13: The histogram below displays the distribution of
Q14: The following graphic was used to visually