Multiple Choice
The graph below displays the number of applications for a concealed weapons permit in Montcalm County, Michigan, for each of three years. A reported interprets this graph to mean that applications in 2010 are more than twice the level in 2008. Is the reported making a correct interpretation? 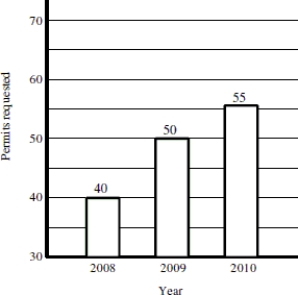
A) Yes. The bar for 2010 is twice the height of the bar for 2008 and the number of applications indicated above the bars shows that applications in 2010 are more than twice the level in 2008.
B) No. Although the 2010 bar is more than twice the height of the 2008, the bars do not begin at 0 applications, so the graph does not correctly represent the data. Fifty- five is not equal to two times the number of applications made in 2008.
C) No. The width of the bars is identical, indicating that the number of applications in 2010 is no different from 2008.
Correct Answer:

Verified
Correct Answer:
Verified
Q44: Which type of take- out food is
Q45: A group of junior high athletes was
Q46: About how many of the swim courses
Q47: Write a sentence to compare color preferences
Q48: The data in the histogram summarizes the
Q50: What was the most common response for
Q51: Explain how to assess variability when presented
Q52: What percentage of college students preferred either
Q53: The distribution of heights of adult males
Q54: Find the original data set from the