Multiple Choice
The data in the histogram summarizes the pitch speed of a sample of 75 pitches for a college pitcher during one season. Which of the following statements best describes the distribution of the histogram below? 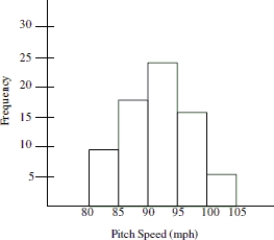
A) The distribution is right- skewed and shows that most of the pitches were more than 90 mph.
B) The distribution has a large amount of variation which can be seen by comparing the heights of the bars in the histogram.
C) The distribution is left- skewed and shows that most of the pitches were less than 95 mph.
D) The distribution is symmetric around a pitch speed of about 93 mph.
Correct Answer:

Verified
Correct Answer:
Verified
Q43: Based on the histogram below, would it
Q44: Which type of take- out food is
Q45: A group of junior high athletes was
Q46: About how many of the swim courses
Q47: Write a sentence to compare color preferences
Q49: The graph below displays the number of
Q50: What was the most common response for
Q51: Explain how to assess variability when presented
Q52: What percentage of college students preferred either
Q53: The distribution of heights of adult males