Multiple Choice
The histogram below displays the distribution of the length of time on hold, for a collection of customers, calling a repair call center. Use the histogram to select the true statement. 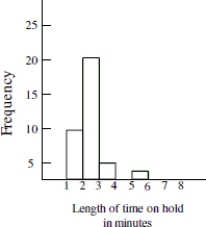
A) The distribution shows that the data was highly variable with some callers waiting on hold as many as 20 minutes.
B) The distribution is symmetrical. The number of callers who waited on hold for less than three minutes was the same as the number of callers who waited on hold for more than three minutes.
C) The distribution is left- skewed and most callers waited on hold at least three minutes.
D) The distribution is right- skewed and most callers waited on hold less than three minutes.
Correct Answer:

Verified
Correct Answer:
Verified
Q8: Compare and contrast the important similarities and
Q9: The histogram below shows the distribution of
Q10: The following graphic was used to visually
Q11: The distribution of test scores for a
Q12: A collection of twenty college students was
Q14: The following graphic was used to visually
Q15: Which of the following statements about bar
Q16: A collection of twenty college students was
Q17: According to the histogram, about how many
Q18: Report the mode for males and females.