Multiple Choice
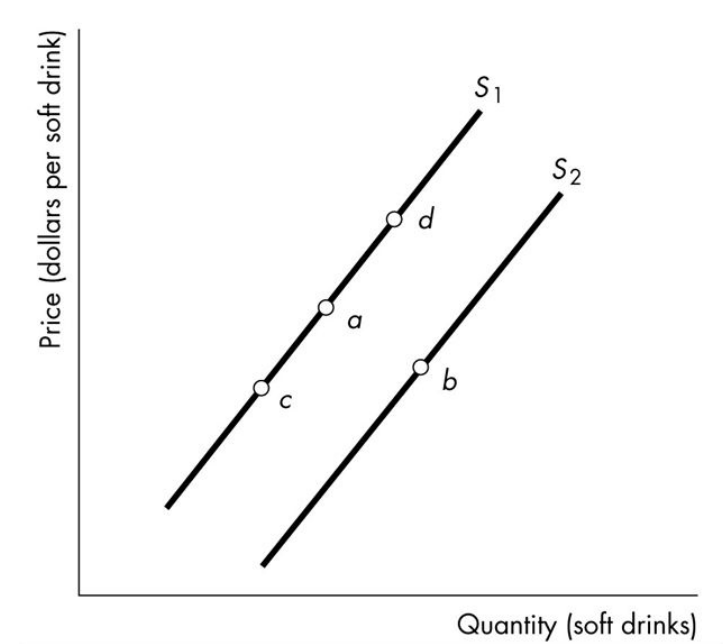
-The figure above shows supply curves for soft drinks. Suppose the economy is at point a. A movement to point b could be the result of
A) an increase in technology.
B) a decrease in the relative price of a soft drink.
C) an increase in the money price of a soft drink.
D) an increase in the relative price of a soft drink.
Correct Answer:

Verified
Correct Answer:
Verified
Q66: The equilibrium price is the price at
Q67: The price of the steel used to
Q68: An increase in the number of fast-
Q69: An increase in technology for producing personal
Q70: The "law of demand" predicts that, other
Q73: Good A and good B are substitutes
Q74: <img src="https://d2lvgg3v3hfg70.cloudfront.net/TB4951/.jpg" alt=" -In the figure
Q75: The "law of demand" refers to the
Q76: The interaction of supply and demand explains<br>A)the
Q388: <img src="https://d2lvgg3v3hfg70.cloudfront.net/TB8586/.jpg" alt=" -The figure above