Multiple Choice
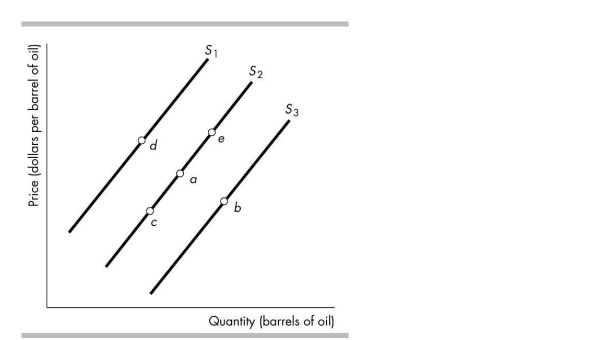
-In the figure above, a decrease in the quantity of oil supplied but NOT a decrease in the supply of oil is shown by a movement from
A) point a to point e.
B) point a to point c.
C) point a to point d.
D) point a to point b.
Correct Answer:

Verified
Correct Answer:
Verified
Q69: An increase in technology for producing personal
Q70: The "law of demand" predicts that, other
Q71: <img src="https://d2lvgg3v3hfg70.cloudfront.net/TB4951/.jpg" alt=" -The figure above
Q73: Good A and good B are substitutes
Q75: The "law of demand" refers to the
Q76: The interaction of supply and demand explains<br>A)the
Q77: When the demand curve shifts rightward and
Q78: An increase in the number of suppliers
Q79: <img src="https://d2lvgg3v3hfg70.cloudfront.net/TB4951/.jpg" alt=" -The figure illustrates
Q388: <img src="https://d2lvgg3v3hfg70.cloudfront.net/TB8586/.jpg" alt=" -The figure above