True/False
The graph shown below can be appropriately modeled by a linear function. 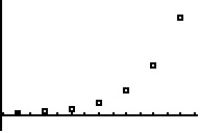
Correct Answer:

Verified
Correct Answer:
Verified
Related Questions
Q2: A data table for <img src="https://d2lvgg3v3hfg70.cloudfront.net/TB7296/.jpg" alt="A
Q3: Suppose f is a linear function and
Q4: If data for <img src="https://d2lvgg3v3hfg70.cloudfront.net/TB7296/.jpg" alt="If data
Q5: The graph shown below can be appropriately
Q6: Suppose f is a linear function and
Q7: If data for <img src="https://d2lvgg3v3hfg70.cloudfront.net/TB7296/.jpg" alt="If data
Q8: Suppose f is a linear function and