Multiple Choice
Below is a graph of a function  .Find the average rate of change in f from 4 to 10 .
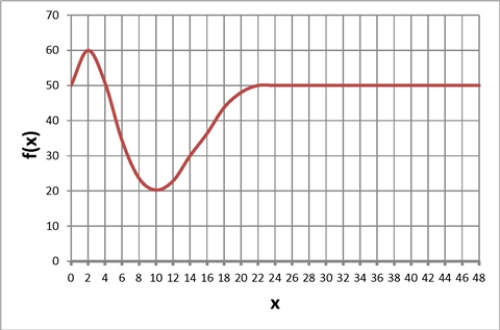
A) 20
B) -5
C) -30
D) None of the above
Correct Answer:

Verified
Correct Answer:
Verified
Related Questions
Q8: Which of the following stories best fits
Q9: The graph below shows the atmospheric pressure,
Q10: Below is a graph of a function
Q11: Below is a graph of a function
Q12: Below is a graph of a function
Q14: Choose the answer that best completes the
Q15: A graph that is concave up represents
Q16: Which of the following stories best fits
Q17: The graph below shows the atmospheric pressure
Q18: Below is a graph of a function