Multiple Choice
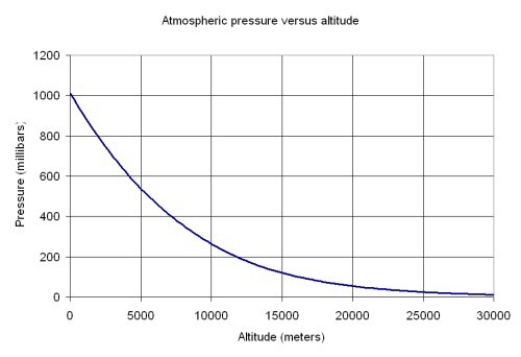
The graph below shows the atmospheric pressure P, in millibars of mercury, as a function of altitude A in meters.According to the graph, what is the approximate value of the solution for A of the equation  ?
? 
A)  meters
B)  meters
C)  meters.
D) The equation has no solution.
Correct Answer:

Verified
Correct Answer:
Verified
Related Questions
Q12: Below is a graph of a function
Q13: Below is a graph of a function
Q14: Choose the answer that best completes the
Q15: A graph that is concave up represents
Q16: Which of the following stories best fits
Q18: Below is a graph of a function
Q19: The graph of a function that is
Q20: Below is a graph of a function
Q21: Below is a graph of a function
Q22: Inflection points may occur where a function