Multiple Choice
Figure 7-4 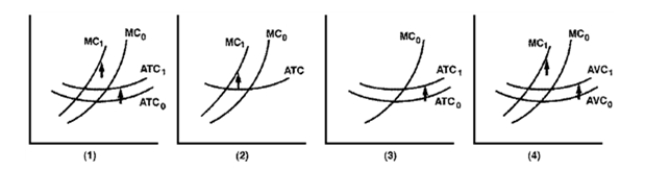
-Following a rash of airplane bombs, the airlines have been forced to increase security at a cost of $30 million per year.The number of inspectors and machines does not vary with the number of passengers; the airlines must have sufficient staff available to handle the full-capacity load.Which graph in Figure 7-4 best illustrates the impact of the security expenditures?
A) 1
B) 2
C) 3
D) 4
Correct Answer:

Verified
Correct Answer:
Verified
Q199: Which of the following will not lead
Q200: Figure 7-1 <img src="https://d2lvgg3v3hfg70.cloudfront.net/TB8592/.jpg" alt="Figure 7-1
Q201: Table 7-1 <img src="https://d2lvgg3v3hfg70.cloudfront.net/TB8592/.jpg" alt="Table 7-1
Q202: The long-run average cost curve<br>A)is a composite
Q203: If the marginal physical product of more
Q205: The amount of time during which at
Q206: If a firm has increasing returns to
Q207: The short-run average cost curve shows the
Q208: If a firm increases inputs by 15
Q209: The firm's average cost curve is the