Related Questions
Q39: Differences in the frequencies of a histogram
Q60: A(n)_ histogram has two peaks,not necessarily equal
Q77: The two most important characteristics to examine
Q110: Briefly explain the difference between correlation and
Q111: Time-series data are often graphically depicted how?<br>A)Bar
Q130: The histogram below has a shape that
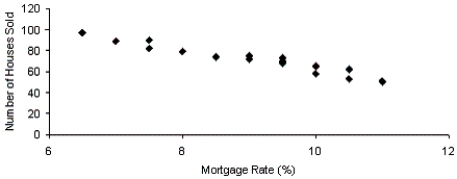
Q131: Insurance Company A representative from a local
Q133: Below are two line charts where the
Q134: Briefly explain why the histogram below is
Q145: A(n)_ is a graphical representation of the