Essay
Briefly explain why the histogram below is misleading. 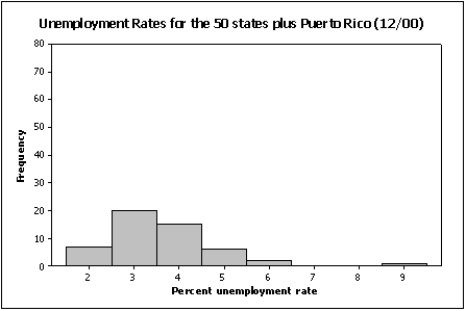
Correct Answer:

Verified
The scale on the Y-axis has be...View Answer
Unlock this answer now
Get Access to more Verified Answers free of charge
Correct Answer:
Verified
The scale on the Y-axis has be...
View Answer
Unlock this answer now
Get Access to more Verified Answers free of charge
Related Questions
Q29: You are less likely to be misled
Q110: Briefly explain the difference between correlation and
Q118: The effect of making the slope of
Q129: The graph below represents a line graph.
Q130: The histogram below has a shape that
Q133: Below are two line charts where the
Q133: It is speculated that the number of
Q139: The first scatter diagram below shows a
Q143: Observations that are measured at successive points
Q145: A(n)_ is a graphical representation of the