Multiple Choice
What type of graph depicts the data below? 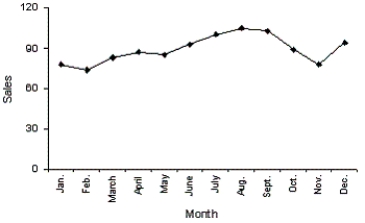
A) A line chart
B) A histogram
C) A dot plot
D) A bar chart
Correct Answer:

Verified
Correct Answer:
Verified
Related Questions
Q6: It is typical that when taking an
Q13: The line chart below shows potato prices
Q14: Electronics Company At a meeting of
Q59: Graphical excellence gives the greatest number of
Q63: Which of the following statements about shapes
Q80: Graphical excellence is nearly always univariate.
Q89: Which of the following characteristics apply to
Q89: Teachers Ages<br>The ages (in years)of a
Q120: Which of the following represents a graphical
Q147: Internet Classes<br>A survey of 25 students