Short Answer
The line chart below shows potato prices per pound for each month from January (month 1) to December last year.By looking at this chart you can see the lowest potato prices occurred in ____________________. 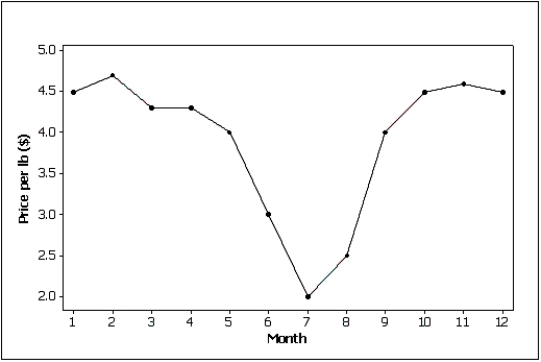
Correct Answer:

Verified
Correct Answer:
Verified
Related Questions
Q10: In its 2000 report, a company presented
Q18: What type of graph depicts the data
Q49: If the form of the graph replaces
Q50: A graph showing trends over time is
Q59: Graphical excellence gives the greatest number of
Q89: Which of the following characteristics apply to
Q90: An individual's income depends somewhat on their
Q120: Which of the following represents a graphical
Q142: Which of the following statements about histograms
Q147: Internet Classes<br>A survey of 25 students