Essay
In its 2000 report, a company presented the following data regarding its sales (in millions of dollars), and net income (in millions of dollars).
 The bar chart below was used to present these data.
 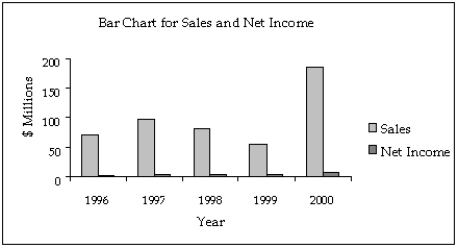 Assume that you are an unscrupulous statistician and want to make the data appear more positive than they really are.Redraw the graph by being selective about which years to include, getting the desired effect.
Correct Answer:

Verified
An unscrupulous statistician could choos...View Answer
Unlock this answer now
Get Access to more Verified Answers free of charge
Correct Answer:
Verified
View Answer
Unlock this answer now
Get Access to more Verified Answers free of charge
Q13: The line chart below shows potato prices
Q34: A pie chart showing 80% yes and
Q49: If the form of the graph replaces
Q50: A graph showing trends over time is
Q59: Graphical excellence gives the greatest number of
Q65: Credit Hours The College of Business at
Q90: An individual's income depends somewhat on their
Q142: Which of the following statements about histograms
Q147: Internet Classes<br>A survey of 25 students
Q151: In a histogram a(n)_ class is the