Multiple Choice
Use the following to answer questions
This histogram represents the distribution of the number of years of education completed by twins who attended the 16th Annual Twins Day Festival in Twinsburg, Ohio, in August of 1991.
Figure: Years of Education 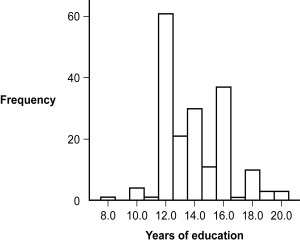
-(Figure: Years of Education) Based on the distribution, what is the number of years of education that was completed by most twins?
A) 12.0
B) 13.0
C) 14.0
D) 16.0
Correct Answer:

Verified
Correct Answer:
Verified
Q79: Ceiling effects can lead to positive skew
Q80: In a frequency polygon, the x-axis represents
Q81: For which situation is a grouped frequency
Q82: Use the following to answer questions <br>This
Q83: A negative skew may have a tail
Q85: Of the different types of distributions, which
Q86: Use the following to answer questions <br>This
Q87: A normal distribution is _, while a
Q88: Which of these is NOT displayed in
Q89: A _ is a visual depiction of