Multiple Choice
Use the following to answer questions
This polygon represents a fictional distribution of scores.
Figure: Frequency Polygon 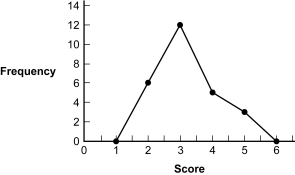
-(Figure: Frequency Polygon) Based on the frequency distribution, how many participants scored between 1 and 3?
A) 2
B) 3
C) 3.5
D) 18
Correct Answer:

Verified
Correct Answer:
Verified
Related Questions
Q79: Ceiling effects can lead to positive skew
Q80: In a frequency polygon, the x-axis represents
Q81: For which situation is a grouped frequency
Q82: Use the following to answer questions <br>This
Q83: A negative skew may have a tail
Q84: Use the following to answer questions <br>This
Q85: Of the different types of distributions, which
Q87: A normal distribution is _, while a
Q88: Which of these is NOT displayed in
Q89: A _ is a visual depiction of