Multiple Choice
Which of the following graphs illustrates the population growth curve starting with a single bacterium growing in a flask of ideal medium at optimum temperature over a two-hour period? Assume resources do not become limiting over this time frame.
A) 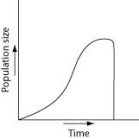
B) 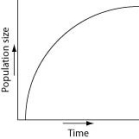
C) 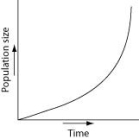
D) 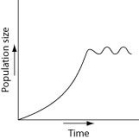
Correct Answer:

Verified
Correct Answer:
Verified
Q24: Use the survivorship curves in the figure
Q25: Which of the following statements regarding the
Q26: Use the graph to answer the following
Q27: Suppose researchers marked 800 turtles and later
Q28: The observation that members of a population
Q29: According to the logistic growth equation below,<br><img
Q30: Which of the following statements about human
Q31: An ecologist recorded 12 white-tailed deer, Odocoileus
Q33: Which of the following is the most
Q44: Scientific study of the population cycles of