Multiple Choice
Use the graph to answer the following question.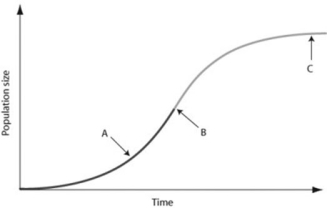
In the figure, which of the arrows represents the carrying capacity?
A) arrow A
B) arrow B
C) arrow C
D) Carrying capacity cannot be found in the figure because species under density-dependent control never reach carrying capacity.
Correct Answer:

Verified
Correct Answer:
Verified
Q21: The following question refers to the figure
Q22: Which pair of terms most accurately describes
Q24: Use the survivorship curves in the figure
Q25: Which of the following statements regarding the
Q27: Suppose researchers marked 800 turtles and later
Q28: Which of the following graphs illustrates the
Q29: According to the logistic growth equation below,<br><img
Q30: Which of the following statements about human
Q31: An ecologist recorded 12 white-tailed deer, Odocoileus
Q44: Scientific study of the population cycles of