Multiple Choice
Use the graph to answer the following question.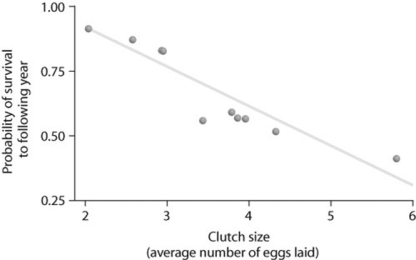
Looking at the data in the figure, what can be said about survival and clutch size?
A) Animals with low survival tend to have smaller clutch sizes.
B) Large clutch size correlates with low survival.
C) Animals with high survival tend to have medium-sized clutches.
D) Probability of survivorship does not correlate with clutch size.
Correct Answer:

Verified
Correct Answer:
Verified
Q56: Which of the following examples would most
Q57: Use the graph to answer the following
Q58: Why does the U.S. population continue to
Q59: Which of the following scenarios would provide
Q60: Use the survivorship curves in the figure
Q62: Which of the following causes populations to
Q63: What is the primary limiting factor that
Q64: Use the graph to answer the following
Q65: You observe two breeding female fish of
Q66: A population of ground squirrels has an