Multiple Choice
Use the graph to answer the following question.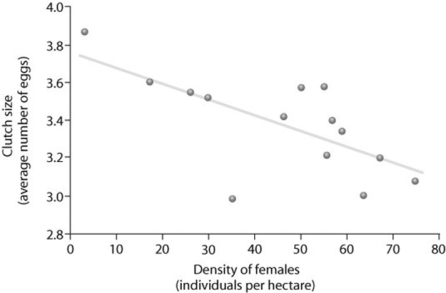
Based on the figure, which of the following statements correctly interprets the data?
A) Clutch size is always lowest at a density of about 35 females.
B) As female density increases, survivorship decreases.
C) Clutch size increases as female density increases.
D) Clutch size is inversely related to density.
Correct Answer:

Verified
Correct Answer:
Verified
Q48: During exponential growth, a population always _.<br>A)
Q59: Which of the following scenarios would provide
Q60: Use the survivorship curves in the figure
Q61: Use the graph to answer the following
Q62: Which of the following causes populations to
Q63: What is the primary limiting factor that
Q65: You observe two breeding female fish of
Q66: A population of ground squirrels has an
Q68: Use the graph to answer the following
Q69: Consider two old-growth forests: One is undisturbed