Multiple Choice
Use the following figure to answer the question.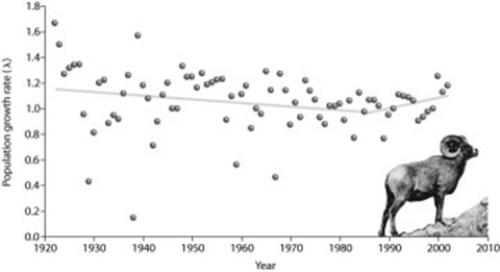
According to the figure, what is the most accurate explanation for the data after 1985?
A) emigration
B) immigration
C) introduction of new alleles into the population
D) increased resources in the area
Correct Answer:

Verified
Correct Answer:
Verified
Q32: Which one of the following is most
Q34: One characteristic that distinguishes a population in
Q35: Use the graphs to answer the question.<br><img
Q36: Which of the following statements is accurate
Q37: Which of the following conditions is the
Q40: Which of the following is a consequence
Q40: Which of the following strategies would most
Q41: A land developer and several ecologists are
Q43: Use the following figure to answer the
Q64: Overharvesting encourages extinction and is most likely