Multiple Choice
Use the graphs to answer the question.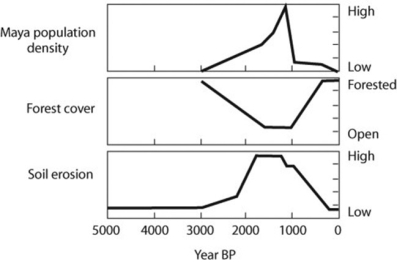
Archeological, fossil, and geological data provide information on the Mayan populations and their environment in Mexico, in the Caribbean state of Yucatán. The graphs depict population size, percentage of the land that was forested, and the amount of soil erosion. Based on the figure, what can you conclude about the history of land use in the southern Yucatán?
A) Massive soil erosion caused the Mayan population to crash.
B) Reduction in forest cover caused the Mayan population to crash.
C) As Mayan population increased, deforestation increased, probably leading to increased soil erosion.
D) This Mayan population practiced sustainable development.
Correct Answer:

Verified
Correct Answer:
Verified
Q30: Loss of biodiversity matters not only with
Q31: Introduced species can have deleterious effects on
Q32: Which of the following threats to biodiversity
Q32: Which one of the following is most
Q33: Use the following figure to answer the
Q34: One characteristic that distinguishes a population in
Q36: Which of the following statements is accurate
Q37: Which of the following conditions is the
Q39: Use the following figure to answer the
Q40: Which of the following is a consequence