Multiple Choice
Use the following figure to answer the question.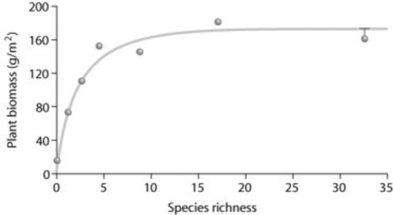
Looking at the figure, what can you conclude about the data?
A) As species richness changes, plant biomass remains consistent.
B) As species richness increases, plant biomass increases.
C) As species richness increases, plant biomass increases and then levels off.
D) As species richness decreases, plant biomass increases.
Correct Answer:

Verified
Correct Answer:
Verified
Q20: Ecosystem services include processes that increase the
Q21: Use the following figure to answer the
Q22: Of the following statements about protected areas
Q22: If the sex ratio in a population
Q23: Why are changes in the global carbon
Q24: Erwin and Scott used an insecticidal fog
Q29: Easter Island is an extremely isolated island
Q30: Loss of biodiversity matters not only with
Q45: Which of the following factors could cause
Q63: Movement corridors can be harmful to certain