Multiple Choice
Use the following figure to answer the question.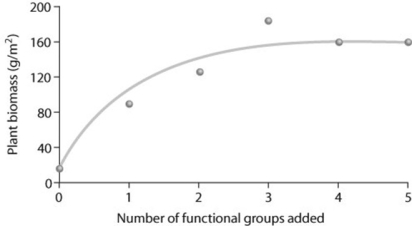
Examine the figure and consider this hypothesis: Plant biomass increases with species richness. Functional groups are categories of plants each containing numerous species, such as grasses and wildflowers, or trees and shrubs. In looking at the data in the figure, how would you relate it to this hypothesis? The hypothesis is ________.
A) partially supported
B) supported
C) rejected
D) neither rejected nor supported
Correct Answer:

Verified
Correct Answer:
Verified
Q16: Burning fossil fuels releases oxides of sulfur
Q18: The main cause of the increase in
Q19: What is a critical load?<br>A) the amount
Q20: Ecosystem services include processes that increase the
Q22: Of the following statements about protected areas
Q23: Why are changes in the global carbon
Q24: Erwin and Scott used an insecticidal fog
Q25: Use the following figure to answer the
Q45: Which of the following factors could cause
Q67: A parasitic fungus, Geomyces destructans, has decimated