Multiple Choice
Use the figure to calculate the income elasticity of demand when income increases from $25,000 to $30,000: 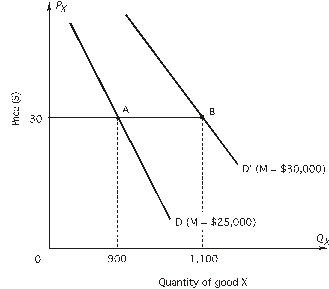
A) -0.10
B) -1.10
C) 0.1818
D) 0.20
E) 1.10
Correct Answer:

Verified
Correct Answer:
Verified
Q2: Use the figure below, which shows a
Q3: Refer to the following figure:<br> <img src="https://d2lvgg3v3hfg70.cloudfront.net/TB2558/.jpg"
Q4: Refer to the following figure:<br> <img src="https://d2lvgg3v3hfg70.cloudfront.net/TB2558/.jpg"
Q5: If the price elasticity of demand for
Q6: <br> <img src="https://d2lvgg3v3hfg70.cloudfront.net/TB2558/.jpg" alt="
Q7: If the quantity of Harley-Davidson motorcycles demanded
Q8: E<sub>1</sub> is demand elasticity for Minutemaid orange
Q9: Refer to the following graph:<br> <img src="https://d2lvgg3v3hfg70.cloudfront.net/TB2558/.jpg"
Q10: Refer to the following figure:<br> <img src="https://d2lvgg3v3hfg70.cloudfront.net/TB2558/.jpg"
Q11: Refer to the following table showing