Multiple Choice
Use the figure below to calculate the cross-price elasticity of demand for good X when the price of good Y increases from $12 to $14: 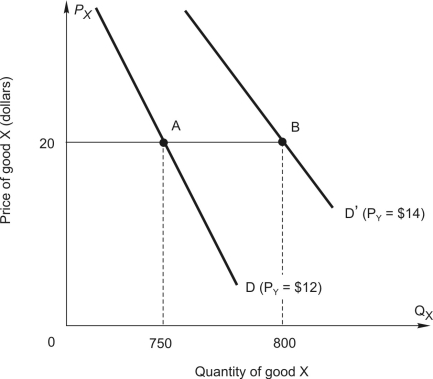
A) 0.645
B) 0.42
C) 0.20
D) 2.00
E) 15.38
Correct Answer:

Verified
Correct Answer:
Verified
Q36: The demand for good X will be
Q37: Refer to the following graph:<br> <img src="https://d2lvgg3v3hfg70.cloudfront.net/TB2558/.jpg"
Q38: Refer to the following figure:<br> <img src="https://d2lvgg3v3hfg70.cloudfront.net/TB2558/.jpg"
Q39: If E<sub>1</sub> is the demand elasticity for
Q40: Refer to the following table showing
Q42: Refer to the following graph:<br> <img src="https://d2lvgg3v3hfg70.cloudfront.net/TB2558/.jpg"
Q43: <br> <img src="https://d2lvgg3v3hfg70.cloudfront.net/TB2558/.jpg" alt="
Q45: Refer to the following table showing
Q46: Refer to the following graph:<br> <img src="https://d2lvgg3v3hfg70.cloudfront.net/TB2558/.jpg"
Q68: Which of the following would tend to