Multiple Choice
Refer to the following graph:
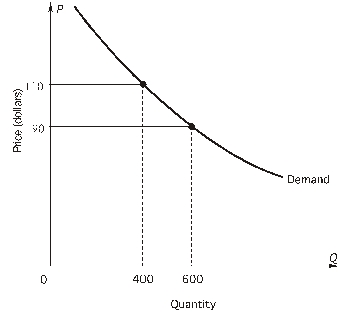
-Suppose price rises from $90 to $110. Using representative arrows, the price effect is a relatively ________ (short, long) arrow pointing _______ (upward, downward) .
A) short; upward
B) short; downward
C) long; upward
D) long; downward
Correct Answer:

Verified
Correct Answer:
Verified
Q37: Refer to the following graph:<br> <img src="https://d2lvgg3v3hfg70.cloudfront.net/TB2558/.jpg"
Q38: Refer to the following figure:<br> <img src="https://d2lvgg3v3hfg70.cloudfront.net/TB2558/.jpg"
Q39: If E<sub>1</sub> is the demand elasticity for
Q40: Refer to the following table showing
Q41: Use the figure below to calculate the
Q43: <br> <img src="https://d2lvgg3v3hfg70.cloudfront.net/TB2558/.jpg" alt="
Q45: Refer to the following table showing
Q46: Refer to the following graph:<br> <img src="https://d2lvgg3v3hfg70.cloudfront.net/TB2558/.jpg"
Q47: <br>"When the British government tripled university
Q68: Which of the following would tend to