Multiple Choice
Refer to the following figure, which shows marginal benefits (MB) and marginal cost (MC) of activity A.
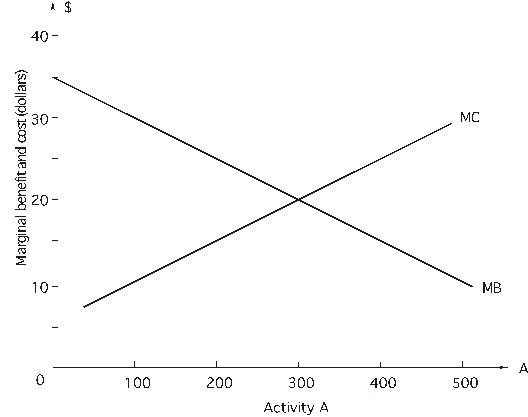
-If the decision maker is choosing 200 units of activity A,
A) this level maximizes net benefits.
B) the activity could be reduced by one unit and net benefits will increase by $10.
C) the activity could be increased by one unit and net benefits will increase by $10.
D) the activity could be increased by one unit and net benefits will increase by $25.
E) the activity could be reduced by one unit and net benefits will increase by $15.
Correct Answer:

Verified
Correct Answer:
Verified
Q8: <br>A government agency is having
Q9: <br>A government agency is having
Q10: <br>A restaurant hires cooks and
Q11: Use the following graph showing the
Q12: Gonzo consumes only two things--coke and hot
Q15: Suppose the marginal benefit of saving one
Q16: The optimal level of any activity is
Q17: <br>A manager in charge of
Q18: A decision maker can choose the
Q22: Whenever the additional revenue from the last