Short Answer
Use the following graph showing the marginal benefit and marginal cost curves for activity A to answer the following questions. 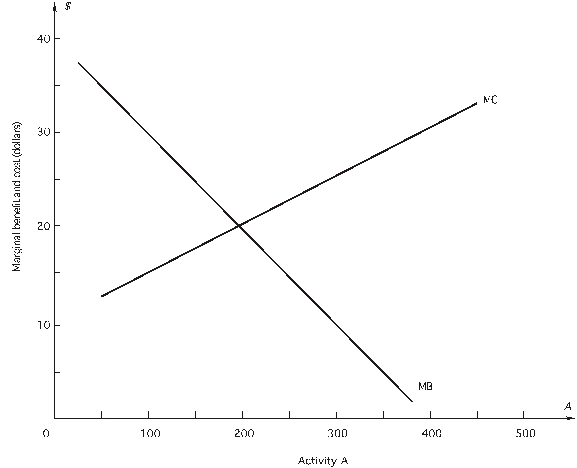
a. Net benefit is maximized when _________ units of A are chosen; marginal benefit is $_________ and marginal cost is $_________.
b. If 300 units of A are chosen, net benefit will increase by $_________ if one _________ unit of A is used.
c. If 100 units of A are chosen, net benefit will increase by $_________ if one _________ unit of A is chosen.
Correct Answer:

Verified
a. 200; $2...View Answer
Unlock this answer now
Get Access to more Verified Answers free of charge
Correct Answer:
Verified
View Answer
Unlock this answer now
Get Access to more Verified Answers free of charge
Q6: <br>A metal refining plant emits
Q7: <br>A housecleaning company receives $25
Q8: <br>A government agency is having
Q9: <br>A government agency is having
Q10: <br>A restaurant hires cooks and
Q12: Gonzo consumes only two things--coke and hot
Q13: Refer to the following figure, which shows
Q15: Suppose the marginal benefit of saving one
Q16: The optimal level of any activity is
Q22: Whenever the additional revenue from the last