Multiple Choice
Use the graph, which shows the average retail prices of 1 gallon of whole milk from 1996 through 2007. 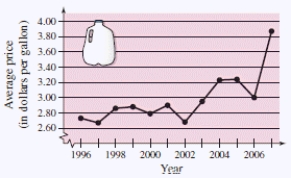
Approximate the lowest price of a gallon of whole milk shown in the graph.When did this occur?
A) $2.97 / gal; 2001
B) $3.17 / gal; 2002
C) $3.07 / gal; 2003
D) $2.67 / gal; 1997
E) $3.87 / gal; 2004
Correct Answer:

Verified
Correct Answer:
Verified
Q12: Determine the quadrant(s)in which (x,y)is located so
Q24: Find the inverse of the one-to-one function.<br><br>y
Q74: Select the correct graph of the
Q75: Select the graph of the given
Q76: A sub shop purchases a used
Q80: A mechanic is paid $13.00 per
Q81: The graph shows the numbers of performers
Q82: Find the graph of the equation.
Q83: An object is thrown upward from a
Q84: Let the function <span class="ql-formula"