Multiple Choice
The graph shows the numbers of performers who were elected to the Rock and Roll Hall of Fame from 1991 through 2008.Describe any trends in the data.From these trends, predict the number of performers elected in 2009. 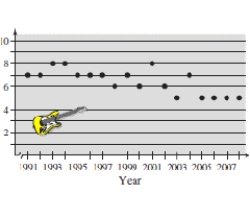
A) The number of performers elected in last four years in the graph seems to be nearly steady except for the first few years therefore five performers will be elected in 2009.
B) The number of performers elected in last four years in the graph seems to be nearly steady except for the first few years therefore seven performers will be elected in 2009.
C) The number of performers elected in last four years in the graph seems to be nearly steady except for the first few years therefore eight performers will be elected in 2009.
D) The number of performers elected in last four years in the graph seems to be nearly steady except for the first few years therefore six performers will be elected in 2009.
E) The number of performers elected in last four years in the graph seems to be nearly steady except for the first few years therefore nine performers will be elected in 2009.
Correct Answer:

Verified
Correct Answer:
Verified
Q12: Determine the quadrant(s)in which (x,y)is located so
Q24: Find the inverse of the one-to-one function.<br><br>y
Q76: A sub shop purchases a used
Q79: Use the graph, which shows the average
Q80: A mechanic is paid $13.00 per
Q82: Find the graph of the equation.
Q83: An object is thrown upward from a
Q84: Let the function <span class="ql-formula"
Q85: Use the given graph of f
Q86: Find the zeros of the