Multiple Choice
The figure below is the ogive for the amount of fat (in grams) for a sample of 36 pizzas products where the upper boundaries of the intervals are: 5, 10, 15, 20, 25, and 30.
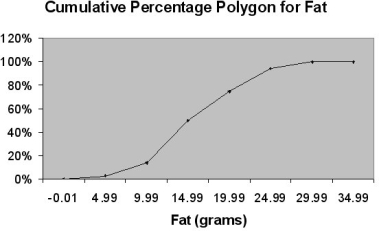
-Referring to Table 2-15, roughly what percentage of pizza products contains less than 10 grams of fat?
A) 75%
B) 50%
C) 14%
D) 3%
Correct Answer:

Verified
Correct Answer:
Verified
Q30: TABLE 2-14<br>The table below contains the number
Q72: Percentage polygons are plotted at the boundaries
Q93: TABLE 2-12<br>The table below contains the opinions
Q126: The main principle behind the Pareto diagram
Q127: TABLE 2-6<br>A sample of 200 students
Q129: <span class="ql-formula" data-value="\text { TABLE 2-4 }"><span
Q131: TABLE 2-16<br>The figure below is the percentage
Q158: TABLE 2-12<br>The table below contains the opinions
Q161: A side-by-side chart is two histograms plotted
Q196: TABLE 2-7<br>The Stem-and-Leaf display below contains data