Multiple Choice
TABLE 2-16
The figure below is the percentage polygon for the amount of calories for a sample of 36 pizzas products where the upper limits of the intervals are: 310, 340, 370, 400 and 430.
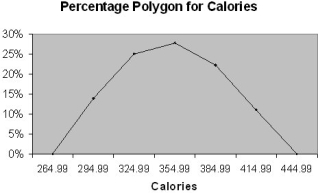
-Referring to Table 2-16, roughly what percentage of pizza products contains between 340 and 400 calories?
A) 50%
B) 28%
C) 25%
D) 22%
Correct Answer:

Verified
Correct Answer:
Verified
Q30: TABLE 2-14<br>The table below contains the number
Q71: TABLE 2-11<br>The ordered array below resulted from
Q126: The main principle behind the Pareto diagram
Q127: TABLE 2-6<br>A sample of 200 students
Q128: <span class="ql-formula" data-value="\text { TABLE 2-15 }"><span
Q129: <span class="ql-formula" data-value="\text { TABLE 2-4 }"><span
Q135: TABLE 2- 5<br>The following are the
Q136: <span class="ql-formula" data-value="\text { TABLE 2-14 }"><span
Q158: TABLE 2-12<br>The table below contains the opinions
Q196: TABLE 2-7<br>The Stem-and-Leaf display below contains data