Multiple Choice
TABLE 2-15
The figure below is the ogive for the amount of fat (in grams) for a sample of 36 pizzas products where the upper boundaries of the intervals are: 5, 10, 15, 20, 25, and 30.
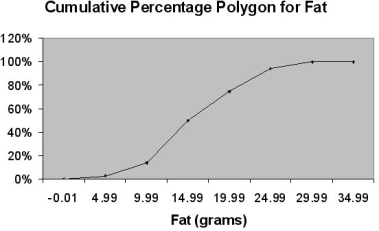
-Referring to Table 2-15, what percentage of pizza products contains at least 20 grams of fat?
A) 96%
B) 75%
C) 5%
D) 25%
Correct Answer:

Verified
Correct Answer:
Verified
Q5: <span class="ql-formula" data-value="\text { TABLE 2-2 }"><span
Q9: TABLE 2-6<br>A sample of 200 students
Q10: TABLE 2-6<br>A sample of 200 students
Q11: <span class="ql-formula" data-value="\text { TABLE 2-16 }"><span
Q13: TABLE 2- 5<br>The following are the
Q42: A good choice for the number of
Q44: TABLE 2-8<br>The Stem-and-Leaf display represents the number
Q99: TABLE 2-12<br>The table below contains the opinions
Q125: TABLE 2-12<br>The table below contains the opinions
Q207: TABLE 2-7<br>The Stem-and-Leaf display below contains data