Short Answer
TABLE 2-8
The Stem-and-Leaf display represents the number of times in a year that a random sample of 100 "lifetime" members of a health club actually visited the facility.
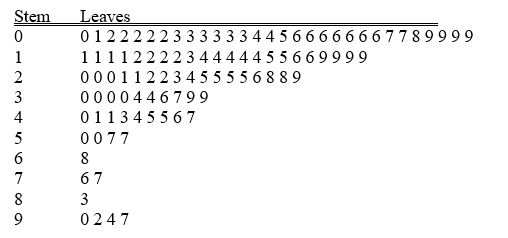
-Referring to Table 2-8, if a frequency distribution with equal sized classes was made from this data, and the first class was "0 but less than 10," the relative frequency of the last class would be ________.
Correct Answer:

Verified
Correct Answer:
Verified
Q39: TABLE 2-6<br>A sample of 200 students at
Q40: TABLE 2-11<br>The ordered array below resulted from
Q41: TABLE 2-9<br>The frequency distribution below represents the
Q43: TABLE 2-9<br>The frequency distribution below represents the
Q45: TABLE 2-17<br>The following table presents total retail
Q47: TABLE 2-15<br>The figure below is the ogive
Q48: Given below is the scatter plot of
Q49: TABLE 2-10<br>The histogram below represents scores achieved
Q104: When constructing charts,the following is plotted at
Q161: In order to compare one large set